Solar Energy Installation Managers


Employment data isn't available specifically for this occupation from the Bureau of Labor Statistics, so we are using the data from First-Line Supervisors of Construction Trades and Extraction Workers.


People also viewed
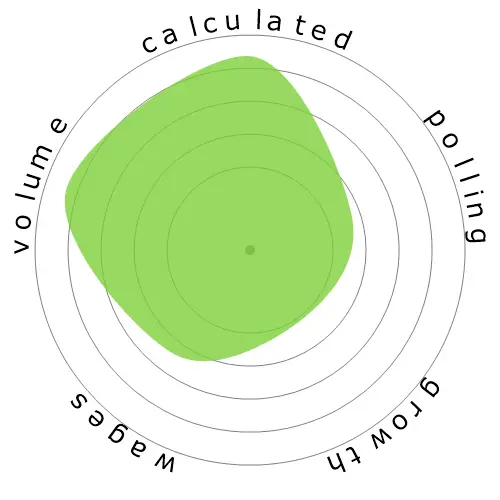
Calculated automation risk
Minimal Risk (0-20%): Occupations in this category have a low probability of being automated, as they typically demand complex problem-solving, creativity, strong interpersonal skills, and a high degree of manual dexterity. These jobs often involve intricate hand movements and precise coordination, making it difficult for machines to replicate the required tasks.
More information on what this score is, and how it is calculated is available here.
User poll
What do you think the risk of automation is?
What is the likelihood that Solar Energy Installation Managers will be replaced by robots or artificial intelligence within the next 20 years?
Growth
The number of 'First-Line Supervisors of Construction Trades and Extraction Workers' job openings is expected to rise 5.9% by 2033
Updated projections are due 09-2025.
Wages
In 2023, the median annual wage for 'First-Line Supervisors of Construction Trades and Extraction Workers' was $76,760, or $36 per hour
'First-Line Supervisors of Construction Trades and Extraction Workers' were paid 59.7% higher than the national median wage, which stood at $48,060
Volume
As of 2023 there were 777,420 people employed as 'First-Line Supervisors of Construction Trades and Extraction Workers' within the United States.
This represents around 0.5% of the employed workforce across the country
Put another way, around 1 in 195 people are employed as 'First-Line Supervisors of Construction Trades and Extraction Workers'.
Job description
Direct work crews installing residential or commercial solar photovoltaic or thermal systems.
SOC Code: 47-1011.03
Leave a reply about this occupation