Automation Risk
Each occupation shows an average probability of automation. A higher score means machines and algorithms are more likely to take over the role in the future.
| 摘要 |
高风险
59%
(计算和投票的平均值)
|
| 工作评分 | 4.5/10 |
| 计算出的 |
63%
(高风险)
|
| 投票 |
54%
(中等风险,
根据 17 票的投票结果)
|
|
增长
到2033年
|
6.9%
|
| 工资 |
$70,620
或每小时 $33.95
|
|
体积
截至 2023
|
4,320
|
| 雪花 |
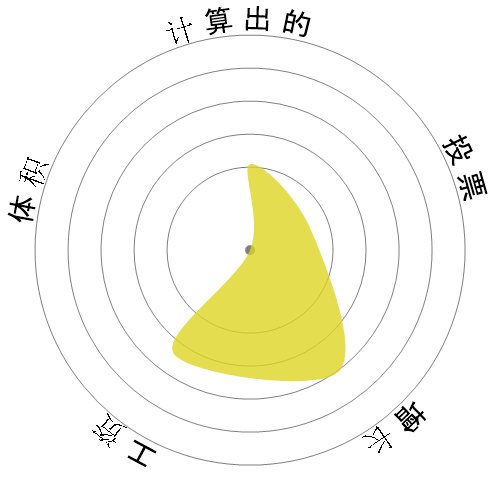
|
| 描述 | 将生物信息学的原理和方法应用于辅助科学家在制药、医疗技术、生物技术、计算生物学、蛋白质组学、计算机信息科学、生物学和医学信息学等领域。应用生物信息学工具来可视化、分析、操作或解释分子数据。可能会建立和维护用于处理和分析基因组或其他生物信息的数据库。 |
Curious how automation and AI could affect your career? Our comparison tool lets you view two or more jobs side by side, helping you quickly spot differences in risk level, pay, growth, and popularity. All of this is based on a mix of academic research, user polling, and official labour data.
Each occupation shows an average probability of automation. A higher score means machines and algorithms are more likely to take over the role in the future.
A quick summary of how a job performs overall — factoring in wages, growth, volume, and automation risk. It’s a handy way to see the bigger picture at a glance.
Thousands of visitors cast their votes on how “automatable” each job feels. These community insights are shown alongside the calculated probabilities.
See how fast each occupation is projected to grow and what people earn on average. High wages don’t always mean high security — automation risk still matters.
Explore how many people currently work in each occupation and in which year the data was recorded. Popularity can affect how disruptive automation will be for the wider economy.
Each snowflake visualises the balance between automation risk, wages, growth, and job volume. Bigger and greener areas mean stronger performance in that dimension.
Use this comparison page to research careers, guide students, or simply explore the future of work. All data is regularly updated to keep the results relevant.