Automation Risk
Each occupation shows an average probability of automation. A higher score means machines and algorithms are more likely to take over the role in the future.
| 摘要 |
高风险
50%
(计算和投票的平均值)
|
| 工作评分 | 6.9/10 |
| 计算出的 |
65%
(高风险)
|
| 投票 |
36%
(低风险,
根据 409 票的投票结果)
|
|
增长
到2033年
|
10.7%
|
| 工资 |
$103,800
或每小时 $49.90
|
|
体积
截至 2023
|
498,810
|
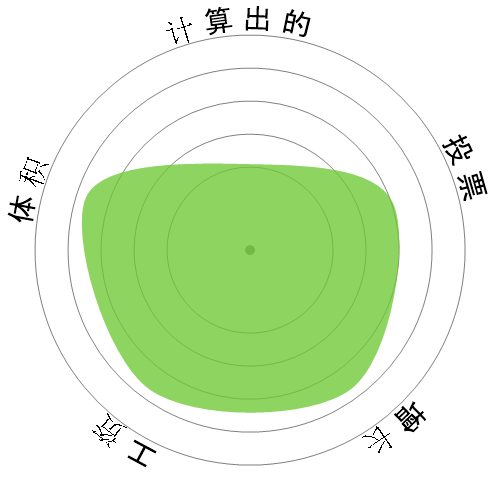
| 雪花 |
|
| 描述 | 分析科学、工程、商业和其他数据处理问题,以开发和实施针对复杂应用问题、系统管理问题或网络问题的解决方案。执行系统管理和集成功能,改进现有的计算机系统,并审查计算机系统的功能、工作流程和时间表限制。可能会分析或推荐商业上可用的软件。 |
Curious how automation and AI could affect your career? Our comparison tool lets you view two or more jobs side by side, helping you quickly spot differences in risk level, pay, growth, and popularity. All of this is based on a mix of academic research, user polling, and official labour data.
Each occupation shows an average probability of automation. A higher score means machines and algorithms are more likely to take over the role in the future.
A quick summary of how a job performs overall — factoring in wages, growth, volume, and automation risk. It’s a handy way to see the bigger picture at a glance.
Thousands of visitors cast their votes on how “automatable” each job feels. These community insights are shown alongside the calculated probabilities.
See how fast each occupation is projected to grow and what people earn on average. High wages don’t always mean high security — automation risk still matters.
Explore how many people currently work in each occupation and in which year the data was recorded. Popularity can affect how disruptive automation will be for the wider economy.
Each snowflake visualises the balance between automation risk, wages, growth, and job volume. Bigger and greener areas mean stronger performance in that dimension.
Use this comparison page to research careers, guide students, or simply explore the future of work. All data is regularly updated to keep the results relevant.