Explore our Data Visualizations
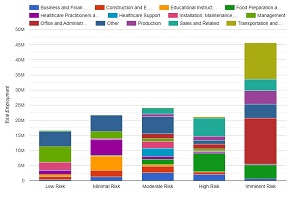
Volume of Jobs by Risk
Explore the distribution of jobs across different risk levels categorized by industry and wage.
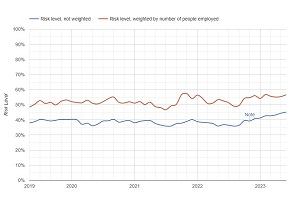
Sentiment Over Time
Track how perception of automation risk has changed over time with user-submitted data.
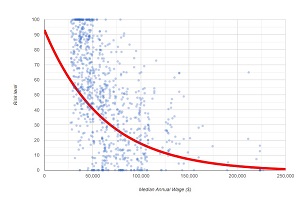
Wages to Risk Correlation
Discover if higher wages correlate with lower risks of automation.
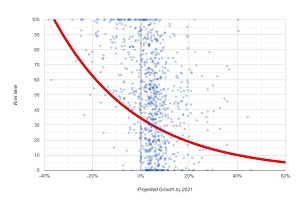
Growth to Risk Correlation
Understand if jobs with more growth potential have less risk of being automated.