Automation Risk
Each occupation shows an average probability of automation. A higher score means machines and algorithms are more likely to take over the role in the future.
| סיכום |
סיכון בינוני
37%
(ממוצע מחושב והצבעות)
|
| ניקוד משרה | 6.5/10 |
| מחושב |
40%
(סיכון בינוני)
|
| מִדְגֵּם |
33%
(סיכון נמוך,
מבוסס על 216 הצבעות)
|
|
צמיחה
עד השנה 2033
|
13.6%
|
| שכר |
64,940 $
או 31.22 $ לשעה
|
|
נפח
נכון ל- 2023
|
17,520
|
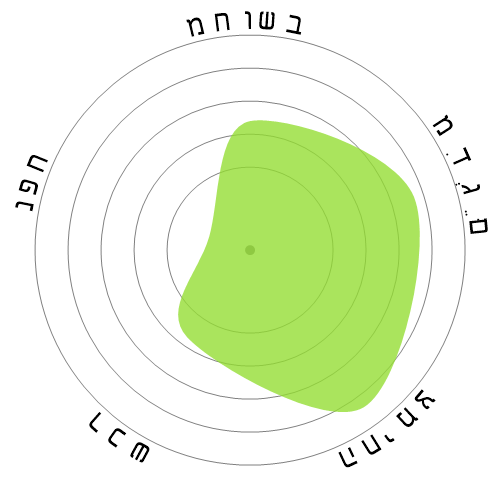
| סנופלייק |
|
| תיאור | אסף, זהה, מיין ונתח ראיות פיזיות הקשורות לחקירות פליליות. בצע בדיקות על נשק או חומרים, כמו סיבים, שיער, ורקמות כדי לקבוע את החשיבות שלהם לחקירה. ייתכן ויעידו כעדים מומחים על ראיות או טכניקות מעבדה פלילית. ייתכן וישרתו כמומחים בתחום התמחותם, כמו בליסטיקה, טביעות אצבעות, כתב יד, או ביוכימיה. |
Curious how automation and AI could affect your career? Our comparison tool lets you view two or more jobs side by side, helping you quickly spot differences in risk level, pay, growth, and popularity. All of this is based on a mix of academic research, user polling, and official labour data.
Each occupation shows an average probability of automation. A higher score means machines and algorithms are more likely to take over the role in the future.
A quick summary of how a job performs overall — factoring in wages, growth, volume, and automation risk. It’s a handy way to see the bigger picture at a glance.
Thousands of visitors cast their votes on how “automatable” each job feels. These community insights are shown alongside the calculated probabilities.
See how fast each occupation is projected to grow and what people earn on average. High wages don’t always mean high security — automation risk still matters.
Explore how many people currently work in each occupation and in which year the data was recorded. Popularity can affect how disruptive automation will be for the wider economy.
Each snowflake visualises the balance between automation risk, wages, growth, and job volume. Bigger and greener areas mean stronger performance in that dimension.
Use this comparison page to research careers, guide students, or simply explore the future of work. All data is regularly updated to keep the results relevant.