Automation Risk
Each occupation shows an average probability of automation. A higher score means machines and algorithms are more likely to take over the role in the future.
| RÉSUMÉ |
Risque Modéré
37%
(Moyenne des calculs et des votes)
|
| SCORE DE TRAVAIL | 6,5/10 |
| CALCULÉ |
40%
(Risque Modéré)
|
| SONDAGE |
33%
(Risque Faible,
Basé sur 216 votes)
|
|
CROISSANCE
par l'année 2033
|
13,6%
|
| SALAIRES |
64 940 $
ou 31,22 $ par heure
|
|
VOLUME
à partir du 2023
|
17 520
|
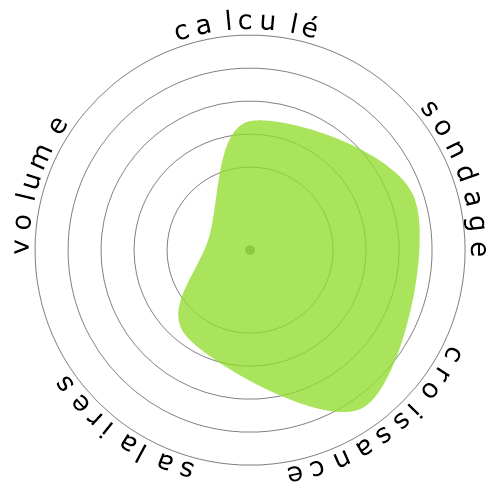
| FLOCON DE NEIGE |
|
| DESCRIPTION | Recueillir, identifier, classer et analyser les preuves physiques liées aux enquêtes criminelles. Effectuer des tests sur des armes ou des substances, telles que des fibres, des cheveux et des tissus pour déterminer leur importance pour l'enquête. Peut témoigner en tant que témoins experts sur les preuves ou les techniques de laboratoire criminel. Peut servir de spécialistes dans un domaine d'expertise, tel que la balistique, les empreintes digitales, l'écriture manuscrite ou la biochimie. |
Curious how automation and AI could affect your career? Our comparison tool lets you view two or more jobs side by side, helping you quickly spot differences in risk level, pay, growth, and popularity. All of this is based on a mix of academic research, user polling, and official labour data.
Each occupation shows an average probability of automation. A higher score means machines and algorithms are more likely to take over the role in the future.
A quick summary of how a job performs overall — factoring in wages, growth, volume, and automation risk. It’s a handy way to see the bigger picture at a glance.
Thousands of visitors cast their votes on how “automatable” each job feels. These community insights are shown alongside the calculated probabilities.
See how fast each occupation is projected to grow and what people earn on average. High wages don’t always mean high security — automation risk still matters.
Explore how many people currently work in each occupation and in which year the data was recorded. Popularity can affect how disruptive automation will be for the wider economy.
Each snowflake visualises the balance between automation risk, wages, growth, and job volume. Bigger and greener areas mean stronger performance in that dimension.
Use this comparison page to research careers, guide students, or simply explore the future of work. All data is regularly updated to keep the results relevant.