Automation Risk
Each occupation shows an average probability of automation. A higher score means machines and algorithms are more likely to take over the role in the future.
| SHRNUTÍ |
Mírné riziko
58%
(Průměr vypočítaných a hlasovaných)
|
| SKÓRE PRÁCE | 5,6/10 |
| VYPOČTENÝ |
59%
(Mírné riziko)
|
| HLASOVÁNÍ |
57%
(Mírné riziko,
Na základě 109 hlasů)
|
|
RŮST
do roku 2033
|
8,3%
|
| MZDY |
74 680 $
nebo 35,90 $ za hodinu
|
|
OBJEM
k datu 2023
|
846 370
|
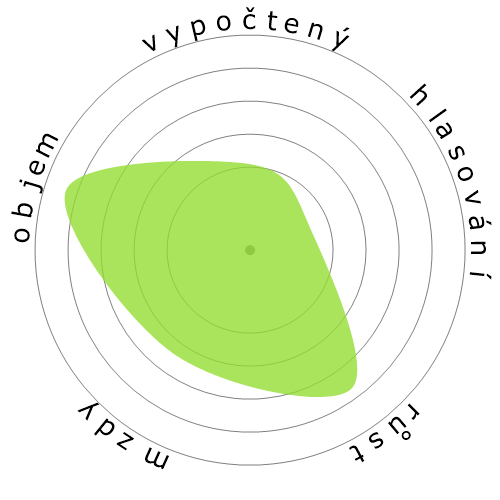
| SNĚHOVÁ VLOČKA |
|
| POPIS | Použijte taktiky vyhledávacího marketingu k zvýšení viditelnosti a interakce s obsahem, produkty nebo službami na zařízeních nebo rozhraních s připojením k internetu. Prozkoumejte chování vyhledávacích dotazů na obecných nebo specializovaných vyhledávačích nebo jiném internetovém obsahu. Analyzujte výzkum, data nebo technologii, abyste pochopili záměr uživatele a měřili výsledky pro průběžnou optimalizaci. |
Curious how automation and AI could affect your career? Our comparison tool lets you view two or more jobs side by side, helping you quickly spot differences in risk level, pay, growth, and popularity. All of this is based on a mix of academic research, user polling, and official labour data.
Each occupation shows an average probability of automation. A higher score means machines and algorithms are more likely to take over the role in the future.
A quick summary of how a job performs overall — factoring in wages, growth, volume, and automation risk. It’s a handy way to see the bigger picture at a glance.
Thousands of visitors cast their votes on how “automatable” each job feels. These community insights are shown alongside the calculated probabilities.
See how fast each occupation is projected to grow and what people earn on average. High wages don’t always mean high security — automation risk still matters.
Explore how many people currently work in each occupation and in which year the data was recorded. Popularity can affect how disruptive automation will be for the wider economy.
Each snowflake visualises the balance between automation risk, wages, growth, and job volume. Bigger and greener areas mean stronger performance in that dimension.
Use this comparison page to research careers, guide students, or simply explore the future of work. All data is regularly updated to keep the results relevant.